
East Maitland NSW

"John Phillips are great plumbers, always reliable. Got them along to fix up stuff-ups by another local plumber - East..."
Get quotes from Raworth plumbers in three easy steps
Tell us what you need and we'll match you with local plumbers.
Receive free quotes and compare prices, reviews, and availability.
Choose the best plumbers for your job based on reviews and price.
Word of Mouth plumbers in Raworth receive an average rating of 4.4 based off 37 reviews.
"John Phillips are great plumbers, always reliable. Got them along to fix up stuff-ups by another local plumber - East..."
"I wanted to express my satisfaction and appreciation of your service. This commenced with the initial reporting of..."
"If you need a plumber around Newcastle area these are the people to use, great service and great tradesman. Would..."
"'Leaking shower tap is all fixed up now! The service was very prompt and professional!'"
"The boys at Cameron park plumbing are great. Calling them with an emergancy with our water system, they promptly..."
"I had occasion to ring Barry when I was having a problem getting my gas heating connected to the bayonet mount. He..."
"I had a wonderful experience with Across Plumbing. Fixed my problem efficiently and quickly. The service was really..."
"We had Ethan attend our apartment to fix a leaking pipe under our kitchen sink and repair our toilet, he was..."
"I am the owner of a number of rental property in the Lake Macquarie area and have been using Cardiff Plumbing for..."
"Laser Plumbing was recommended by a friend who has used them several times. We were very grateful for the..."
"I had to have oold water pipes replaced from the water meter. This plumber was very efficeint and did the job on time."
"'Sam from Terrace Hot Water was excellent. He installed my hot water unit successfully and I was quite happy with how..."
"'Friendly and polite, and knew his business, and did the work very quickly.'"
"Steve saved my roof from becominmg water logged. He was quick and efficent and a nice Aussie bloke. I would..."
Showing 20 of 25 businesses
Market Intelligence
Data-driven insights based on 37 customer reviews collected between 2008 and 2026, ABS Census data, and 1 trust signal responses
Raworth plumbers average 4.4 stars — 0.5 stars below the NSW average of 4.88, with ratings on an upward trend in recent years, based on 37 customer reviews across 25 plumbers servicing the area.
Interesting pattern in Raworth: income runs above the national median ($2,203/week vs $1,748/week) but local plumbers price 64% below the NSW average. Worth comparing quotes to take advantage of that.
Review flow for plumbers in Raworth is lighter than typical — 2.8 new reviews a year, 74% below the NSW average. Consider this when comparing local ratings to busier suburbs.
Based on 37 customer reviews collected on Word of Mouth between 2008–2026, and ABS Census 2021 data.
| Year | Reviews | Average rating out of 5 | Median reported cost |
|---|---|---|---|
| 2008 | 2 | 4.0 | no prices reported |
| 2009 | 3 | 4.7 | no prices reported |
| 2010 | 2 | 4.0 | no prices reported |
| 2011 | 2 | 5.0 | no prices reported |
| 2012 | 2 | 5.0 | no prices reported |
| 2013 | 2 | 4.5 | no prices reported |
| 2014 | 16 | 4.1 | no prices reported |
| 2015 | 1 | 5.0 | no prices reported |
| 2016 | 2 | 5.0 | no prices reported |
| 2017 | 2 | 3.0 | no prices reported |
| 2020 | 1 | 5.0 | no prices reported |
| 2022 | 1 | 5.0 | no prices reported |
| 2026 | 1 | 5.0 | no prices reported |
Based on Word of Mouth reviews 2008–2026
How we calculate the Local Service Score: We combine two sources of data: first-party data collected directly by Word of Mouth — customer reviews, customer-reported pricing, post-service trust-signal responses, and service awards — with suburb-level population and housing data from the Australian Bureau of Statistics 2021 Census. The score measures how well Raworth is served for plumbers, reflecting the depth of choice, quality of service, and value for money available to residents compared to other suburbs across Australia. See our Local Service Score methodology for data sources, update frequency, and quality guardrails.
Trade licences shown on the listing when the business has supplied them, with the licence number.
Where enough customers have reported it, the listing shows the typical price range for the job they reviewed.
Australians have been reviewing local businesses here since 2007. How we handle reviews, disputes and removals is set out in our Fair Play Policy.
Browse our comprehensive cost guides to find the average national price for your job.
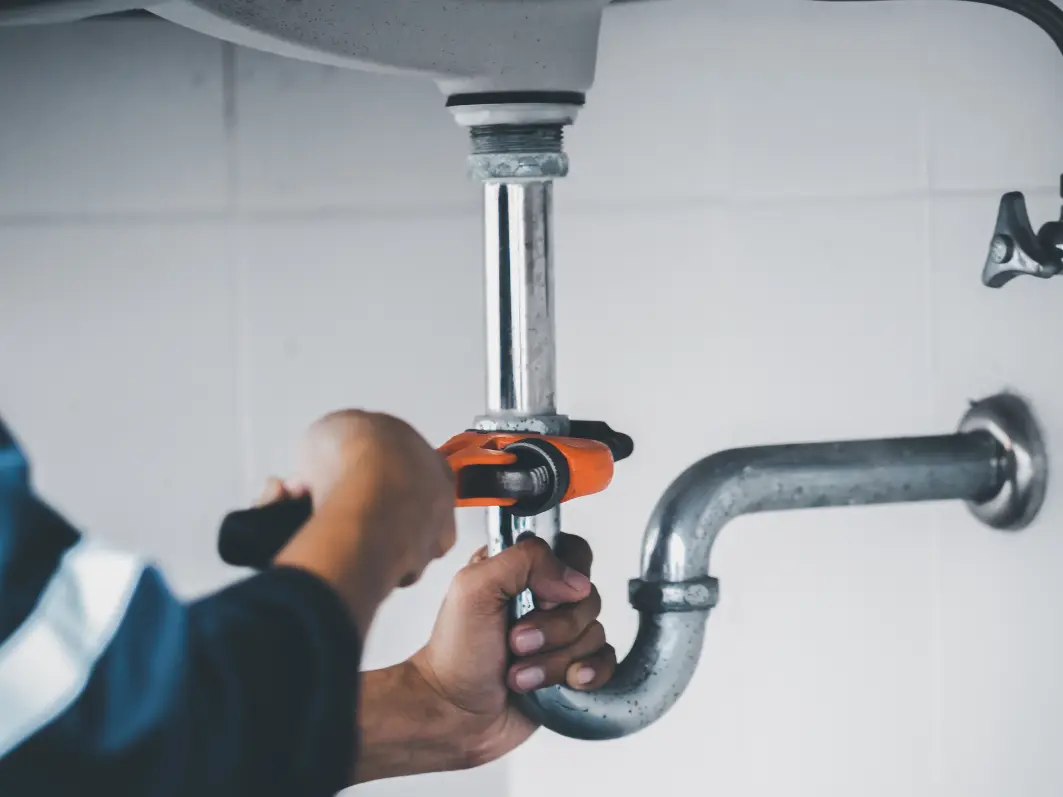
Average hourly rate $100 - $150
Average cost $75 - $500
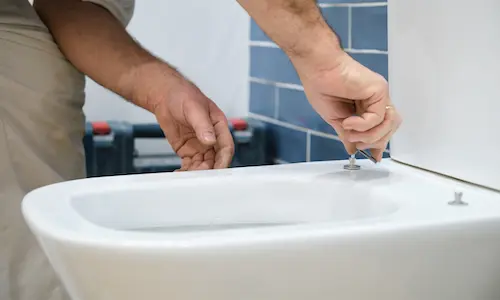
Average price $200 - $500

A system-by-system guide to 2026 prices for jugs, under-sink, RO, UV, whole-house, softeners, and tank/bore filtration. Including who actually needs filtration and what to look for on the WaterMark sticker.
Start by comparing customer reviews — Raworth has 37 plumber reviews on Word of Mouth.
Plumbers in Raworth have an average rating of 4.4 out of 5 stars, based on 37 customer reviews on Word of Mouth. This is below the NSW average of 4.88 stars.
Interesting pattern in Raworth: income runs above the national median ($2,203/week vs $1,748/week) but local plumbers price 64% below the NSW average. Worth comparing quotes to take advantage of that. For context, ABS Census 2021 data shows Raworth has 89% of dwellings are standalone houses, a median age of 36, a median household income of $2,203/week.

