
Campbelltown NSW

"Thank you for your service & care today fixing another plumbers mistake "
Get quotes from Ruse plumbers in three easy steps
Tell us what you need and we'll match you with local plumbers.
Receive free quotes and compare prices, reviews, and availability.
Choose the best plumbers for your job based on reviews and price.
Word of Mouth plumbers in Ruse receive an average rating of 4.8 based off 34 reviews.
"Thank you for your service & care today fixing another plumbers mistake "
"Ray is a great plumber providing fantastic service at very competitive prices. Call Wheeler Draining for all plumbing..."
"I had to replace a gas hot water system recently 135 litre as my previous Dux system had failed. Searched around for..."
"Anyone who needs the assistance of a plumber in the campbelltown region should give crg a call. Cameron came out to..."
"quick response time, good price, did a very neat job, honest friendly advise, highly recommend"
In total, 1008 jobs have recently been posted for plumbers on the Word of Mouth jobs marketplace. Across Word of Mouth, the average quote response time for plumbers is 47.6 hours. Quotes sent back through the marketplace average $574 for a fixed-price job, and $308.00 an hour where the work is quoted hourly. These are quotes, not final invoices. For what customers reported paying, see the cost breakdown below.
46 plumbers have submitted licence details, which our support team has manually verified. These were accurate at the time of submission, but we recommend checking official registers to confirm they continue to remain valid before hiring any business.
Trade licences shown on the listing when the business has supplied them, with the licence number.
Where enough customers have reported it, the listing shows the typical price range for the job they reviewed.
Australians have been reviewing local businesses here since 2007. How we handle reviews, disputes and removals is set out in our Fair Play Policy.
Browse our comprehensive cost guides to find the average national price for your job.
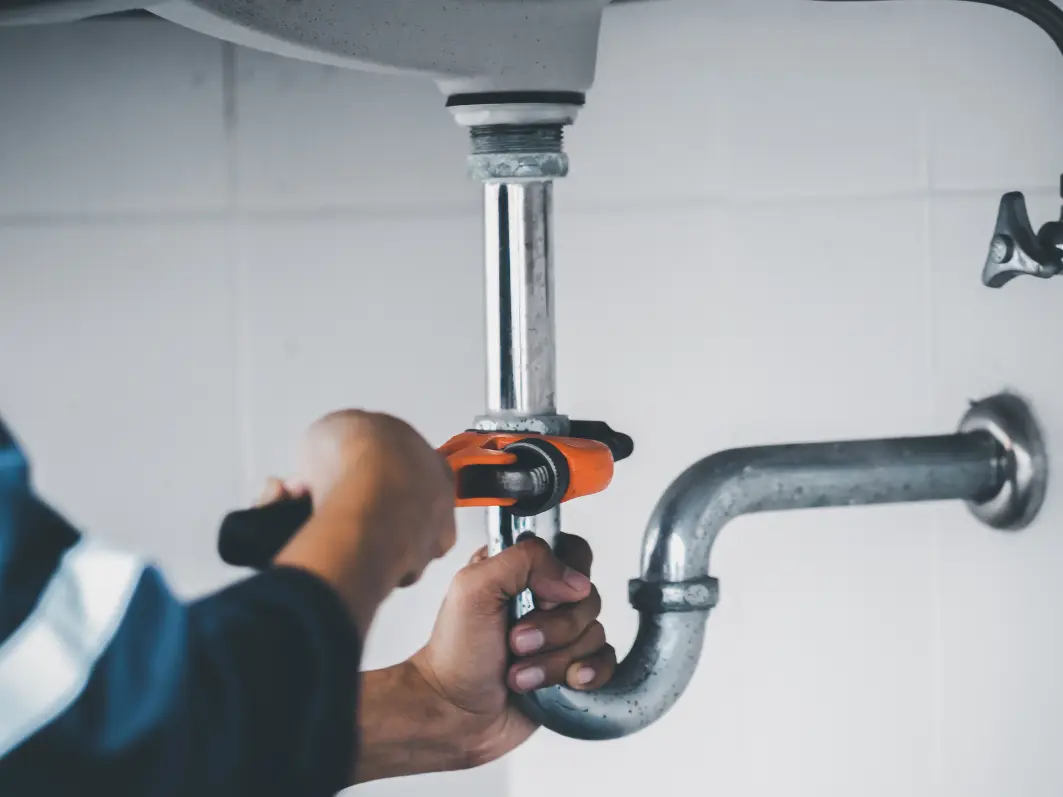
Average hourly rate $100 - $150
Average cost $75 - $500
Average price $200 - $500

A system-by-system guide to 2026 prices for jugs, under-sink, RO, UV, whole-house, softeners, and tank/bore filtration. Including who actually needs filtration and what to look for on the WaterMark sticker.
Ruse household incomes sit above the national median ($1,797/week vs $1,748/week), yet local plumbers charge 28% less than the NSW average — a pricing anomaly worth noticing before you assume affluent-suburb rates apply. For context, ABS Census 2021 data shows Ruse has 97% of dwellings are standalone houses, a median age of 38, a median household income of $1,797/week.
