Skip to business listings

Compare quotes

Find the best cleaners in Robina, QLD

View reviews, compare quotes and book professional cleaners in Robina online.

Average rating of cleaners near Robina
4.9 based on 75 reviews of 17 businesses

How it works

Get quotes from Robina cleaners in three easy steps

1

Describe

Tell us what you need and we'll match you with local cleaners.

2

Compare

Receive free quotes and compare prices, reviews, and availability.

3

Connect

Choose the best cleaners for your job based on reviews and price.

Browse and compare

Best Robina cleaners near you

Word of Mouth cleaners in Robina receive an average rating of 4.9 based off 75 reviews.

Aussie Bright Cleaning

5.0
1 review
Quality 5.0 Service 5.0 Value 5.0
Special Offer
Gold Coast QLD

"Amazing job by Aussie Bright Cleaning. Very reasonable price, quality job. Prompt reply and service too. Highly..."

Showing 20 of 25 businesses

Market Intelligence

Cleaners servicing Robina

Data-driven insights based on 75 customer reviews collected between 2009 and 2026, ABS Census data, and 1 trust signal responses

74 / 100
Local Service Score
1 Award Winners
99% Positive Feedback

Robina cleaners are rated 4.9 out of 5 stars — 0.4 stars above the Queensland average of 4.51, with ratings on an upward trend in recent years, based on 75 customer reviews across 25 cleaners servicing the area.

Demand patterns

Demand for cleaners in Robina peaks around August and drops to its quietest in May based on review patterns — something to factor in if your job is flexible on dates.

About this suburb

With household income at $1,758/week (above the $1,748/week national median), you'd expect cleaners pricing in Robina to run premium — but it actually lands 93% below the Queensland average, which means more room to get value here.

What locals say

Review activity here is higher than typical: Robina averages 5.4 new cleaner reviews a year — 50% above the Queensland average — a larger sample than most suburbs in the state.

What it costs

Based on customer-reported pricing on Word of Mouth, prices have risen 48% since 2010 (from $25 to $37 median), averaging 3.7% per year.

Based on 75 customer reviews collected on Word of Mouth between 2009–2026, and ABS Census 2021 data.

5.4 / yr Review velocity -5%
4.9 stars Avg rating above avg
$37 Typical cost -89%
5.0 stars Service rating
3.0 avg Reviews / provider
9.7 / 10k Provider density

Cleaner reviews & ratings over time — Robina area

See the figures behind this chart
Cleaner reviews, ratings and typical cost by year in the Robina area, from customer reviews on Word of Mouth.
Year Reviews Average rating out of 5 Median reported cost
2009 2 4.0 no prices reported
2010 2 5.0 $25
2012 4 5.0 $155
2014 1 4.0 no prices reported
2015 18 5.0 $150
2016 12 4.8 $100
2017 10 4.9 $118
2018 5 5.0 no prices reported
2019 1 5.0 no prices reported
2020 2 5.0 no prices reported
2021 10 5.0 no prices reported
2022 4 4.0 no prices reported
2023 3 5.0 $37
2026 1 5.0 no prices reported

Based on Word of Mouth reviews 2009–2026

Based on customer-reported prices. Outliers removed.

Robina area profile ABS Census 2021

25,659 Population
32.6% Own with mortgage
54.6% Houses
$1,758 Median income / week

How we calculate the Local Service Score: We combine two sources of data: first-party data collected directly by Word of Mouth — customer reviews, customer-reported pricing, post-service trust-signal responses, and service awards — with suburb-level population and housing data from the Australian Bureau of Statistics 2021 Census. The score measures how well Robina is served for cleaners, reflecting the depth of choice, quality of service, and value for money available to residents compared to other suburbs across Australia. See our Local Service Score methodology for data sources, update frequency, and quality guardrails.

What you can check before you call

Licences, where they’ve got them

Trade licences shown on the listing when the business has supplied them, with the licence number.

What other customers paid

Where enough customers have reported it, the listing shows the typical price range for the job they reviewed.

Reviews going back to 2007

Australians have been reviewing local businesses here since 2007. How we handle reviews, disputes and removals is set out in our Fair Play Policy.

527+
Jobs posted
1.36
Average quotes per job
Based on the most recent job posts for cleaners in Robina.

More cleaners near you

Cleaners in Robina — FAQs

When should I book a cleaner for the best availability?

Based on historical review patterns on Word of Mouth, cleaner demand in Robina tends to peak in August and is quietest in May. Booking during quieter months may mean more providers available and faster response times.

How do I find a good cleaner in Robina?

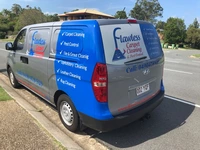
Start by comparing customer reviews — Robina has 75 cleaner reviews on Word of Mouth. Flawless Carpet Cleaning & Pest Control (2018) has earned a Word of Mouth Service Award — an award that recognises consistently high customer ratings over a calendar year.

How well-rated are cleaners in Robina?

Cleaners in Robina have an average rating of 4.9 out of 5 stars, based on 75 customer reviews on Word of Mouth. This is above the Queensland average of 4.51 stars.

How does the Robina area shape local cleaner demand?

With household income at $1,758/week (above the $1,748/week national median), you'd expect cleaners pricing in Robina to run premium — but it actually lands 93% below the Queensland average, which means more room to get value here. For context, ABS Census 2021 data shows Robina has a median age of 39, a median household income of $1,758/week.

Are you a business owner?

Join thousands of Australian businesses on Word of Mouth. Get discovered by customers actively looking for your services.