
Bellmere QLD
"'We were happy with Wust plumbing who did a good job installing our slimline water tank. We have used them several..."
Get quotes from Rocksberg plumbers in three easy steps
Tell us what you need and we'll match you with local plumbers.
Receive free quotes and compare prices, reviews, and availability.
Choose the best plumbers for your job based on reviews and price.
Word of Mouth plumbers in Rocksberg receive an average rating of 4.7 based off 39 reviews.
"'We were happy with Wust plumbing who did a good job installing our slimline water tank. We have used them several..."

"I have used this company before and because I found them to not only to provide good service and product but had an..."
"Great, reliable and affordable plumber! Dan was very diligent with his work which gave us confidence. He is very..."
"Who are you gunna call, why Keillor's of course! Fixed my blocked septic and gave valuable advice. The job was done..."
"Platt's Plumbing gave me sound advice on my renovation and corrected the errors I had made. Have recommended them..."
"Taps n toilets were very professional in the work and explained everything I needed to know when replacing the..."
"Terry offers good old-fashioned service. He comes at the agreed time and if he's held up always phones to let you..."
"Great service and very friendly Will use them again."
"I recommend Wagner plumbing if you need very helpful service in a short timeframe. Recently I needed a gravel..."
"I called this plumber from the pocket book, I was quoted on my job within 24hours. Rob the plumber was very friendly,..."
"Cannot speak highly enough of this company, prompt, reliable and a pleasure to deal with. Errol is such a..."
"Engaged Alex from Diamond Plumbing Group, QLD to replace kitchen tap fittings, shower accessories and instant gas hot..."
"Great service very professional and prompt. Highly recommend this company to anyone looking to dig up part of their..."
"Excellent service turned up on time. would highly recommend the drain camera it saved us a lot of money. Will..."
"Excellent service. Garry is friendly, honest and thorough. He also charges at a very reasonable rate. Two thumbs up!"
"I had JL do a job for me in Caboolture (March 2011) and I found him to be very interested in doing a high quality job..."
"Rick from Dayboro Plumbing did a great job fixing our burst water pipe last week. He came out promptly and provided..."
"Steve does a great job, he turns up on time (or early) and gives alot of attention to details. He responds to..."
"We had to get these guys out when we had a huge leak at the side of the house where our outside tap is. 10 minites on..."
Showing 20 of 25 businesses
Market Intelligence
Data-driven insights based on 38 customer reviews collected between 2007 and 2023, ABS Census data
Rocksberg is one of the pricier areas for plumbers — 56% above the Queensland average. 25 plumbers service the area with 38 customer reviews.
Incomes in Rocksberg run above the national median ($1,805/week vs $1,748/week), and plumbers pricing follows — sitting 56% above the Queensland average. Worth getting multiple quotes to find the right value point within that range.
Review volume in Rocksberg runs lower than typical: 3.5 new plumber reviews per year, 90% under the Queensland average. The ratings here are based on a narrower sample and may respond more slowly to recent customer experience.
Based on 38 customer reviews collected on Word of Mouth between 2007–2023, and ABS Census 2021 data.
| Year | Reviews | Average rating out of 5 | Median reported cost |
|---|---|---|---|
| 2007 | 1 | 5.0 | no prices reported |
| 2009 | 4 | 5.0 | no prices reported |
| 2010 | 2 | 5.0 | no prices reported |
| 2011 | 4 | 4.8 | no prices reported |
| 2012 | 6 | 4.5 | no prices reported |
| 2013 | 4 | 4.8 | no prices reported |
| 2014 | 12 | 4.6 | no prices reported |
| 2020 | 1 | 5.0 | no prices reported |
| 2021 | 2 | 5.0 | no prices reported |
| 2022 | 1 | 5.0 | no prices reported |
| 2023 | 1 | 5.0 | no prices reported |
Based on Word of Mouth reviews 2007–2023
How we calculate the Local Service Score: We combine two sources of data: first-party data collected directly by Word of Mouth — customer reviews, customer-reported pricing, post-service trust-signal responses, and service awards — with suburb-level population and housing data from the Australian Bureau of Statistics 2021 Census. The score measures how well Rocksberg is served for plumbers, reflecting the depth of choice, quality of service, and value for money available to residents compared to other suburbs across Australia. See our Local Service Score methodology for data sources, update frequency, and quality guardrails.
Trade licences shown on the listing when the business has supplied them, with the licence number.
Where enough customers have reported it, the listing shows the typical price range for the job they reviewed.
Australians have been reviewing local businesses here since 2007. How we handle reviews, disputes and removals is set out in our Fair Play Policy.
Browse our comprehensive cost guides to find the average national price for your job.
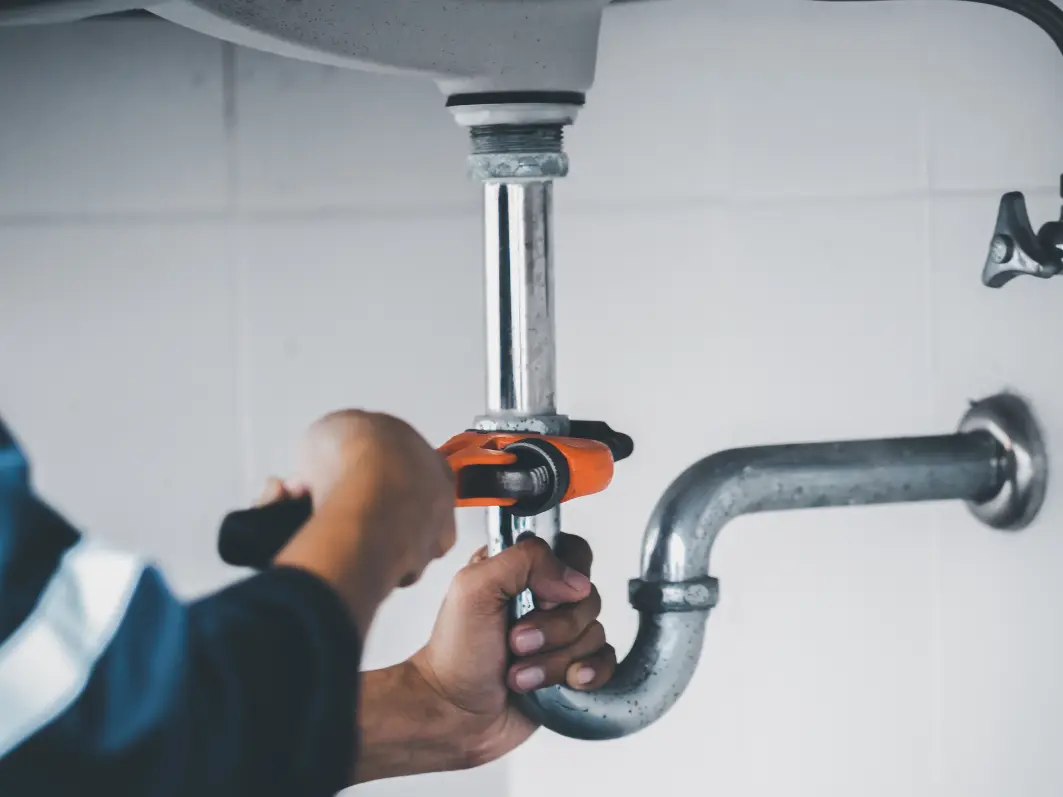
Average hourly rate $100 - $150
Average cost $75 - $500
Average price $200 - $500

A system-by-system guide to 2026 prices for jugs, under-sink, RO, UV, whole-house, softeners, and tank/bore filtration. Including who actually needs filtration and what to look for on the WaterMark sticker.
Start by comparing customer reviews — Rocksberg has 38 plumber reviews on Word of Mouth.
Plumbers in Rocksberg have an average rating of 4.7 out of 5 stars, based on 38 customer reviews on Word of Mouth. This is below the Queensland average of 4.89 stars.
Incomes in Rocksberg run above the national median ($1,805/week vs $1,748/week), and plumbers pricing follows — sitting 56% above the Queensland average. Worth getting multiple quotes to find the right value point within that range. For context, ABS Census 2021 data shows Rocksberg has 93% of dwellings are standalone houses, a median age of 52, a median household income of $1,805/week.
