Campbelltown NSW

"Highly recommended. Great customer service, reliable and affordable. "
Get quotes from Appin plumbers in three easy steps
Tell us what you need and we'll match you with local plumbers.
Receive free quotes and compare prices, reviews, and availability.
Choose the best plumbers for your job based on reviews and price.
Word of Mouth plumbers in Appin receive an average rating of 4.9 based off 76 reviews.
"Highly recommended. Great customer service, reliable and affordable. "
"Ray provides excellent service at the right price. I would recommend him to anyone. I have many friends who've also..."
"Very prompt and professional. Ben provided advice and solved our plumbing issue. We would use his services again. "
"We were doing some landscaping and needed the services of a plumber to raise our water meter, as well as fix a pipe..."
"I needed my very old gas oven disconnected, new gas cooktop installed and a frustrating pipe run through the roof to..."
"A big thank you to Graham from Cobra Maintenance. Very professional, reliable and friendly. Great plumber, highly..."
"They came to my shop install our new gas water heater and were very professional. I had a new business at the time,..."
"Had Shannon in to fix our blocked sewer was able to come on short notice at a time convenient to me. Friendly..."
"Great customer service- got back to me the same day and had it fixed by the afternoon. Did a fantastic job! Would..."
"I had to replace a gas hot water system recently 135 litre as my previous Dux system had failed. Searched around for..."
"Would recommend Mark and associates for an excellent job arranged electrical work and fitted service in great time."
"I needed some help with blockages and being a stay at home mum with 2 little kids and sorting out organising a..."
"Staff are courteous, friendly and skilled professionals. Jay helped us. He was professional and offered advice and..."
"I have always had problems with plumbers, but not with Daniel. Great service, reliable, trustworthy, i'll be..."
"I highly recommend Paul Canty Plumbing for anything you need done urgently. Really friendly and helpful and are..."
"cupex plumbing cleared my blocked sewer on a Saturday afternoon, they were here within the hour and provided an..."
"We had a blocked drain where tree roots grew and needed a plumber to clean it out. They made a timeto come over and..."
"Great experience, actually turned up on time (unusual for a tradie) Fixed the first time and very reasonable rates...."

"If you're looking for a one stop bathroom renovation shop, look no further than Engadine Plumbing Supplies. Kurt and..."
"FANTASTIC! We arrived home from a 2 week holiday to a plumbing nightmare. We called at 5.05pm and he was here at..."

"Tom and his team at Southern Plumbing Projects recently looked after all the plumbing for my renovation and I..."
"Punctual, completed the job in a professional manner."
"For all you Plumbing, Gas Fitting, Hot Water or Drainage requirements, no job is too big or too small for the boys at..."
"Quality tradesman!! Fair and accurate quote, showed up on time, great communication. Highly recommended."
"Zach has helped us out of many a mess, from Calistamon roots in the sewer to installing a gas line from the lounge to..."
Showing 20 of 25 businesses
Market Intelligence
Data-driven insights based on 76 customer reviews collected between 2008 and 2025, ABS Census data
Appin is one of the more affordable areas for plumbers — 28% below the NSW average. 25 plumbers service the area with 76 customer reviews.
Despite above-median household incomes ($2,423/week vs the national median of $1,748/week), plumbers in Appin charge 28% below the NSW average — better value than the suburb's income profile might suggest.
If you have flexibility on timing, our review data shows plumber demand in Appin tends to peak around November and ease off in March — booking during quieter periods may mean more providers available and faster response times.
Appin averages 5.1 new plumber reviews per year, 56% below the NSW average. Fewer recent reviews means the ratings may reflect a smaller sample of customer experiences.
Based on customer-reported pricing on Word of Mouth, prices have risen 44% since 2009 (from $250 to $360 median), averaging 3.4% per year.
Based on 76 customer reviews collected on Word of Mouth between 2008–2025, and ABS Census 2021 data.
| Year | Reviews | Average rating out of 5 | Median reported cost |
|---|---|---|---|
| 2008 | 1 | 5.0 | no prices reported |
| 2009 | 3 | 4.0 | $250 |
| 2010 | 5 | 5.0 | $300 |
| 2011 | 8 | 4.9 | no prices reported |
| 2012 | 20 | 4.9 | no prices reported |
| 2013 | 9 | 5.0 | no prices reported |
| 2014 | 7 | 4.4 | $385 |
| 2016 | 2 | 5.0 | no prices reported |
| 2017 | 8 | 5.0 | $220 |
| 2020 | 2 | 5.0 | no prices reported |
| 2021 | 5 | 5.0 | no prices reported |
| 2022 | 2 | 5.0 | $360 |
| 2023 | 2 | 5.0 | no prices reported |
| 2024 | 1 | 5.0 | no prices reported |
| 2025 | 1 | 5.0 | no prices reported |
Based on Word of Mouth reviews 2008–2025
Based on customer-reported prices. Outliers removed.
How we calculate the Local Service Score: We combine two sources of data: first-party data collected directly by Word of Mouth — verified customer reviews, customer-reported pricing, post-service trust-signal responses, and service awards — with suburb-level population and housing data from the Australian Bureau of Statistics 2021 Census. The score measures how well Appin is served for plumbers, reflecting the depth of choice, quality of service, and value for money available to residents compared to other suburbs across Australia. See our Local Service Score methodology for data sources, update frequency, and quality guardrails.
Trade licences shown on the listing when the business has supplied them, with the licence number.
Where enough customers have reported it, the listing shows the typical price range for the job they reviewed.
Australians have been reviewing local businesses here since 2007. How we handle reviews, disputes and removals is set out in our Fair Play Policy.
Browse our comprehensive cost guides to find the average national price for your job.
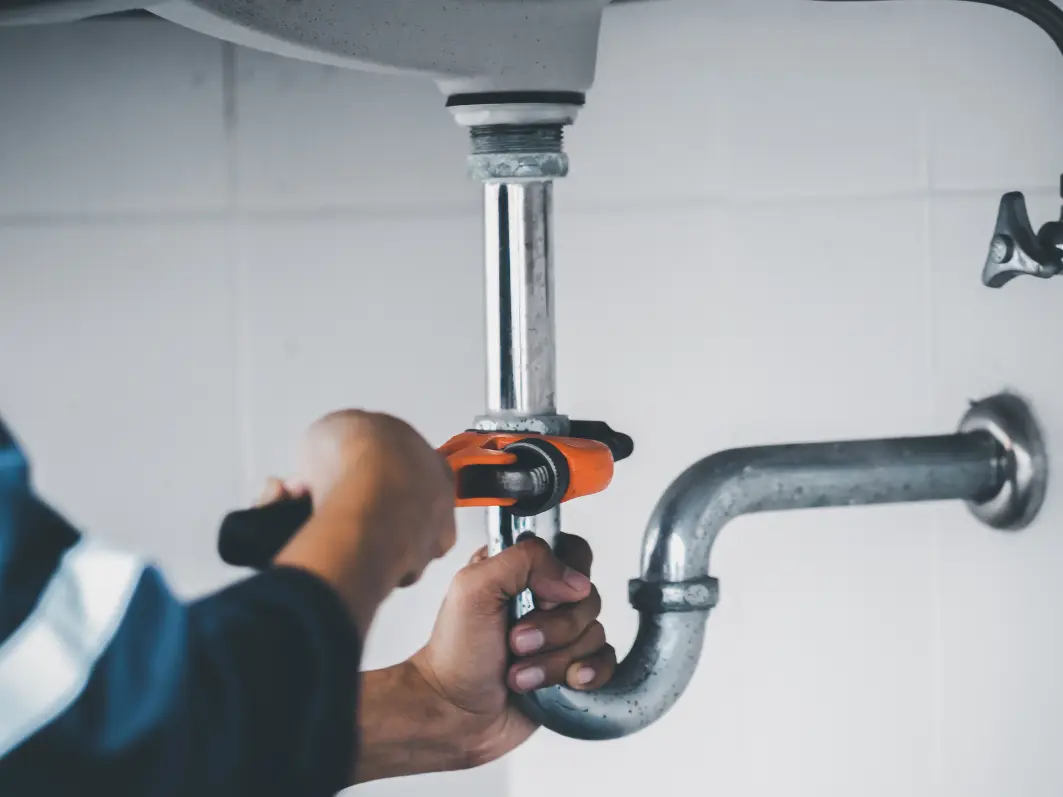
Average hourly rate $100 - $150
Average cost $75 - $500
Average price $200 - $500

A system-by-system guide to 2026 prices for jugs, under-sink, RO, UV, whole-house, softeners, and tank/bore filtration. Including who actually needs filtration and what to look for on the WaterMark sticker.
Based on historical review patterns on Word of Mouth, plumber demand in Appin tends to peak in November and is quietest in March. Booking during quieter months may mean more providers available and faster response times.
Start by comparing reviews from real customers — Appin has 76 plumber reviews on Word of Mouth. Dad & Dave's Plumbing Services (2012) has earned a Word of Mouth Service Award — an award that recognises consistently high customer ratings over a calendar year.
Plumbers in Appin have an average rating of 4.9 out of 5 stars, based on 76 customer reviews on Word of Mouth.
Despite above-median household incomes ($2,423/week vs the national median of $1,748/week), plumbers in Appin charge 28% below the NSW average — better value than the suburb's income profile might suggest. For context, ABS Census 2021 data shows Appin has 96% of dwellings are standalone houses, a median age of 33, a median household income of $2,423/week.