
Blaxland NSW

"Good plumbers, good service, didn't have to wait too long for them to come. They like to contribute to the local..."
Get quotes from Lapstone plumbers in three easy steps
Tell us what you need and we'll match you with local plumbers.
Receive free quotes and compare prices, reviews, and availability.
Choose the best plumbers for your job based on reviews and price.
Word of Mouth plumbers in Lapstone receive an average rating of 3.8 based off 20 reviews.
"Good plumbers, good service, didn't have to wait too long for them to come. They like to contribute to the local..."
"I had an issue where a lot of water was seeping up through the backyard. It was really sloppy to walk on and the kids..."
"Laura's review Michael was very helpful, arrived on time and went to the extra effort to make sure the problem was..."
"Brett has been our plumber for the past few years. Never had a problem. Great work and great service. Highly recommend!"
"They turned up on time, gave me a good price on the gas work and cleaned the mess when they were finished, would..."
"He responded well to phone calls, arranged a time to come and came at appointed time. He was courteous and personable..."
"'I used Nick to remove a toilet and all associated plumbing and he did a fantastic job. He was very professional and..."

"Zack provided outstanding plumbing service today. He was punctual, professional, and very informative, taking the..."
Market Intelligence
Data-driven insights based on 20 customer reviews collected between 2010 and 2026, ABS Census data, and 1 trust signal responses
Lapstone plumbers average 3.8 stars — 1.1 stars below the NSW average of 4.87, with ratings on an upward trend in recent years, based on 20 customer reviews across 19 plumbers servicing the area.
Lapstone household incomes sit above the national median ($2,339/week vs $1,748/week), yet local plumbers charge 46% less than the NSW average — a pricing anomaly worth noticing before you assume affluent-suburb rates apply.
Lapstone's plumber ratings have improved from 3.6/5 (2010) to 5.0/5 (2026), suggesting a local market that's getting stronger over time. With 2.9 new plumber reviews per year here — 75% below the NSW average — the current ratings are based on a smaller sample than most areas, worth keeping in mind when comparing providers.
Based on 20 customer reviews collected on Word of Mouth between 2010–2026, and ABS Census 2021 data.
| Year | Reviews | Average rating out of 5 | Median reported cost |
|---|---|---|---|
| 2010 | 3 | 4.7 | no prices reported |
| 2012 | 5 | 3.2 | no prices reported |
| 2013 | 3 | 3.0 | no prices reported |
| 2014 | 6 | 3.7 | no prices reported |
| 2015 | 1 | 5.0 | no prices reported |
| 2021 | 1 | 5.0 | no prices reported |
| 2026 | 1 | 5.0 | no prices reported |
Based on Word of Mouth reviews 2010–2026
Sample-size note: This page is built on 20 customer reviews — a smaller sample than our typical suburb page. Ratings and patterns here may shift materially as more data arrives.
How we calculate the Local Service Score: We combine two sources of data: first-party data collected directly by Word of Mouth — customer reviews, customer-reported pricing, post-service trust-signal responses, and service awards — with suburb-level population and housing data from the Australian Bureau of Statistics 2021 Census. The score measures how well Lapstone is served for plumbers, reflecting the depth of choice, quality of service, and value for money available to residents compared to other suburbs across Australia. See our Local Service Score methodology for data sources, update frequency, and quality guardrails.
Trade licences shown on the listing when the business has supplied them, with the licence number.
Where enough customers have reported it, the listing shows the typical price range for the job they reviewed.
Australians have been reviewing local businesses here since 2007. How we handle reviews, disputes and removals is set out in our Fair Play Policy.
Browse our comprehensive cost guides to find the average national price for your job.
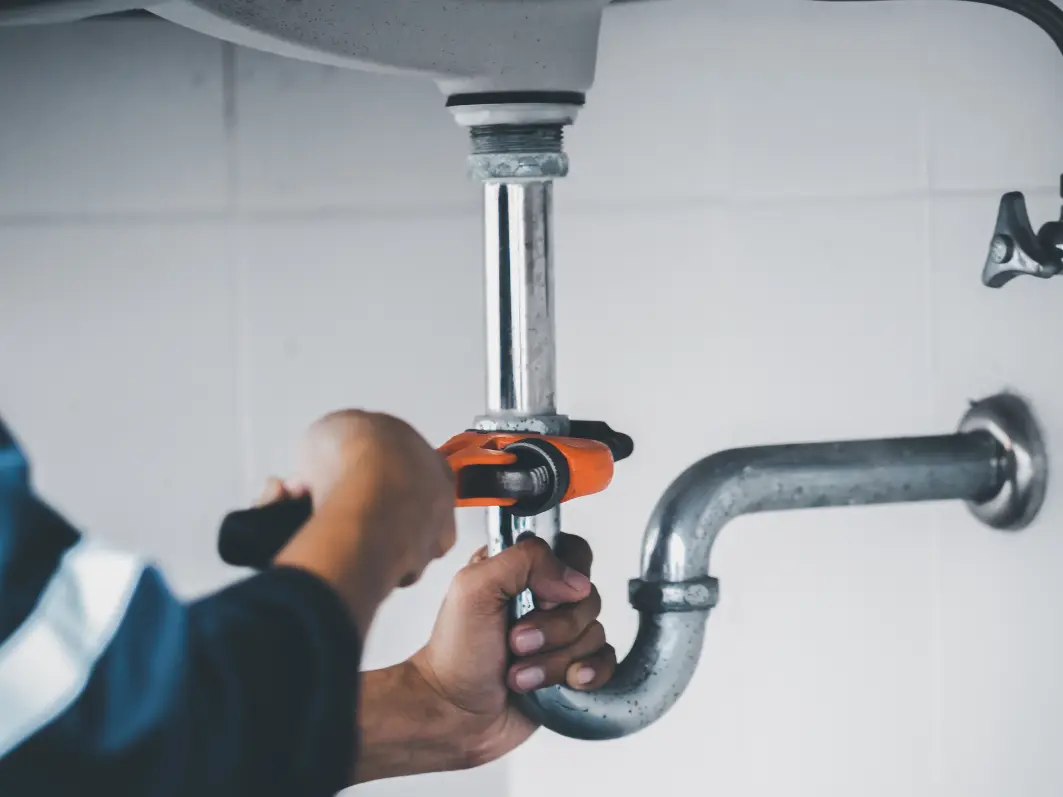
Average hourly rate $100 - $150
Average cost $75 - $500
Average price $200 - $500

A system-by-system guide to 2026 prices for jugs, under-sink, RO, UV, whole-house, softeners, and tank/bore filtration. Including who actually needs filtration and what to look for on the WaterMark sticker.
Start by comparing customer reviews — Lapstone has 20 plumber reviews on Word of Mouth.
Plumbers in Lapstone have an average rating of 3.8 out of 5 stars, based on 20 customer reviews on Word of Mouth. This is below the NSW average of 4.87 stars.
Lapstone household incomes sit above the national median ($2,339/week vs $1,748/week), yet local plumbers charge 46% less than the NSW average — a pricing anomaly worth noticing before you assume affluent-suburb rates apply. For context, ABS Census 2021 data shows Lapstone has 98% of dwellings are standalone houses, a median age of 44, a median household income of $2,339/week.


