
Mudgeeraba QLD
Tuesday: 7am til 7pm

"Excellent service, i would highly recommended to friends etc. Thanks Dan "
Get quotes from Robina pest control in three easy steps
Tell us what you need and we'll match you with local pest control.
Receive free quotes and compare prices, reviews, and availability.
Choose the best pest control for your job based on reviews and price.
Word of Mouth pest control in Robina receive an average rating of 4.8 based off 65 reviews.
"Excellent service, i would highly recommended to friends etc. Thanks Dan "
"Have used Dedant a number of times both for investment and personal properties, can’t recommend them enough. Thorough..."
"I have found zero critters to be honest, reliable and prompt. Always friendly and communicates clearly. Happy to..."

"Pest Corp offers annual Gold Coast pest control services with superior quality workmanship and higher customer..."
"They came to my house and did the treatment in no time at all, it was quick and easy! I would highly recommend them!..."
"Long established family business, Had mice in roof , Brad came round immediately and mice were gone following day...."
"Paradise Pest Control does interior and exterior pest control service. We have used their services every 6 months for..."
"Very happy with the young man who did our termite inspection. Very knowledgeable, friendly and professional. Highly..."
"I was very upset over a buyer pest inspection I had and the inspector cut 3 holes in my walls and put ugly vents in..."
"Termite inspection and pest control! Always happy with Dave and Mac they do a great job and very friendly and..."
Showing 20 of 25 businesses
In total, 160 jobs have recently been posted for pest control experts on the Word of Mouth jobs marketplace. Across Word of Mouth, the average quote response time for pest control experts is 56.4 hours. Quotes sent back through the marketplace average $275 for a fixed-price job. These are quotes, not final invoices. For what customers reported paying, see the cost breakdown below.
Trade licences shown on the listing when the business has supplied them, with the licence number.
Where enough customers have reported it, the listing shows the typical price range for the job they reviewed.
Australians have been reviewing local businesses here since 2007. How we handle reviews, disputes and removals is set out in our Fair Play Policy.
Based on historical review patterns on Word of Mouth, pest control demand in Robina tends to peak in June and is quietest in May. Booking during quieter months may mean more providers available and faster response times.
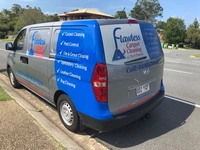
Start by comparing reviews from real customers — Robina has 5 pest control reviews on Word of Mouth. Flawless Carpet Cleaning & Pest Control (2018) has earned a Word of Mouth Service Award — an award that recognises consistently high customer ratings over a calendar year.
With household income at $1,758/week (above the $1,748/week national median), you'd expect pest control pricing in Robina to run premium — but it actually lands 30% below the Queensland average, which means more room to get value here. For context, ABS Census 2021 data shows Robina has a median age of 39, a median household income of $1,758/week.
