
Cedar Vale QLD

"This company is always prompt and reliable. A short while ago our pump went and so we had no water. This was on a..."
Get quotes from Cedar Vale plumbers in three easy steps
Tell us what you need and we'll match you with local plumbers.
Receive free quotes and compare prices, reviews, and availability.
Choose the best plumbers for your job based on reviews and price.
Word of Mouth plumbers in Cedar Vale receive an average rating of 4.7 based off 53 reviews.
"This company is always prompt and reliable. A short while ago our pump went and so we had no water. This was on a..."
"Reliable work, accommodating service and reasonable prices: what more could you ask for. I have used this business..."
"Highest recommendation for this company. I called them at 10am in the morning to say that a hot water system on our..."
"All the taps in my place required servicing and/or washer replacement. I emailed enquiry to Gareth on Wednesday..."
"We used these guys in our old house when we were renting. Great value for lpg gas bottles at under $90"
"Highly recommend this business. First email was answered very promptly followed by a friendly call to give us a..."
"Prompt amazing service friendly and helpful. will be using again when we need a plumber"
"Excellent service, prompt and got us out of an emergency plumbing problem. Will definitely be using JC Plumbing in..."
"I had empire plumbing out for a on going tree root issue in my sewer drain, Nick came out after hours and cleared the..."
"Great service, very fast and efficient! he was hundreds of dollars under my origianl quote. Would recommend Graeme to..."
"Ricky has been my plumber for some time now and has always carried out any repair works with total professionalism. ..."
"Always friendly, helpful and does a great job. Thank you."
"We needed a plumber at short notice, one call to Darrell and everything was looked after in a very short time. His..."
"We called at 3pm on a Friday afternoon thinking that we would get the usual "sorry, but we are fully booked" reply...."

"The most experienced, high quality plumbers around. They'll do it right the first time & you'll save money in the..."
"The most experienced, high quality plumbers around. They'll do it right the first time & you'll save money in the..."
"On time, friendly, informative, reasonably priced. Definitely will be MY plumber from now on."
"I called Darren to fix my water main when it burst and he came out straight away. I would highly recommend him to..."
"The man that came to our house was really nice and helpful. We didn't have the money to get a new hot water system..."
"We keep using Moyle Plumbing because they always consistently provide excellent and reliable service and quality..."
Showing 20 of 25 businesses
In total, 991 jobs have recently been posted for plumbers on the Word of Mouth jobs marketplace. Across Word of Mouth, the average quote response time for plumbers is 48.8 hours. Quotes sent back through the marketplace average $584 for a fixed-price job, and $308.00 an hour where the work is quoted hourly. These are quotes, not final invoices. For what customers reported paying, see the cost breakdown below.
46 plumbers have submitted licence details, which our support team has manually verified. These were accurate at the time of submission, but we recommend checking official registers to confirm they continue to remain valid before hiring any business.
Market Intelligence
Data-driven insights based on 53 customer reviews collected between 2007 and 2025, ABS Census data
Cedar Vale is one of the more affordable areas for plumbers — 91% below the Queensland average. 25 plumbers service the area with 53 customer reviews.
Interesting pattern in Cedar Vale: income runs above the national median ($2,261/week vs $1,748/week) but local plumbers price 91% below the Queensland average. Worth comparing quotes to take advantage of that.
Review patterns in Cedar Vale suggest plumber demand runs hottest in April and coolest in January — if your timing is flexible, booking outside peak can shorten the wait.
Local plumber ratings have trended down from 4.8/5 (2007) to 3.3/5 (2025) — worth asking prospective providers what's changed. Review flow for plumbers in Cedar Vale is lighter than typical — 3.8 new reviews a year, 89% below the Queensland average. Consider this when comparing local ratings to busier suburbs.
Based on 53 customer reviews collected on Word of Mouth between 2007–2025, and ABS Census 2021 data.
| Year | Reviews | Average rating out of 5 | Median reported cost |
|---|---|---|---|
| 2007 | 1 | 4.0 | no prices reported |
| 2008 | 1 | 5.0 | no prices reported |
| 2009 | 1 | 5.0 | no prices reported |
| 2010 | 10 | 5.0 | no prices reported |
| 2011 | 3 | 5.0 | no prices reported |
| 2012 | 7 | 4.7 | no prices reported |
| 2013 | 10 | 4.9 | no prices reported |
| 2014 | 8 | 5.0 | no prices reported |
| 2015 | 6 | 5.0 | no prices reported |
| 2016 | 1 | 5.0 | no prices reported |
| 2019 | 2 | 5.0 | no prices reported |
| 2021 | 1 | 1.0 | no prices reported |
| 2022 | 1 | 1.0 | no prices reported |
| 2025 | 1 | 1.0 | no prices reported |
Based on Word of Mouth reviews 2007–2025
How we calculate the Local Service Score: We combine two sources of data: first-party data collected directly by Word of Mouth — verified customer reviews, customer-reported pricing, post-service trust-signal responses, and service awards — with suburb-level population and housing data from the Australian Bureau of Statistics 2021 Census. The score measures how well Cedar Vale is served for plumbers, reflecting the depth of choice, quality of service, and value for money available to residents compared to other suburbs across Australia. See our Local Service Score methodology for data sources, update frequency, and quality guardrails.
Trade licences shown on the listing when the business has supplied them, with the licence number.
Where enough customers have reported it, the listing shows the typical price range for the job they reviewed.
Australians have been reviewing local businesses here since 2007. How we handle reviews, disputes and removals is set out in our Fair Play Policy.
Browse our comprehensive cost guides to find the average national price for your job.
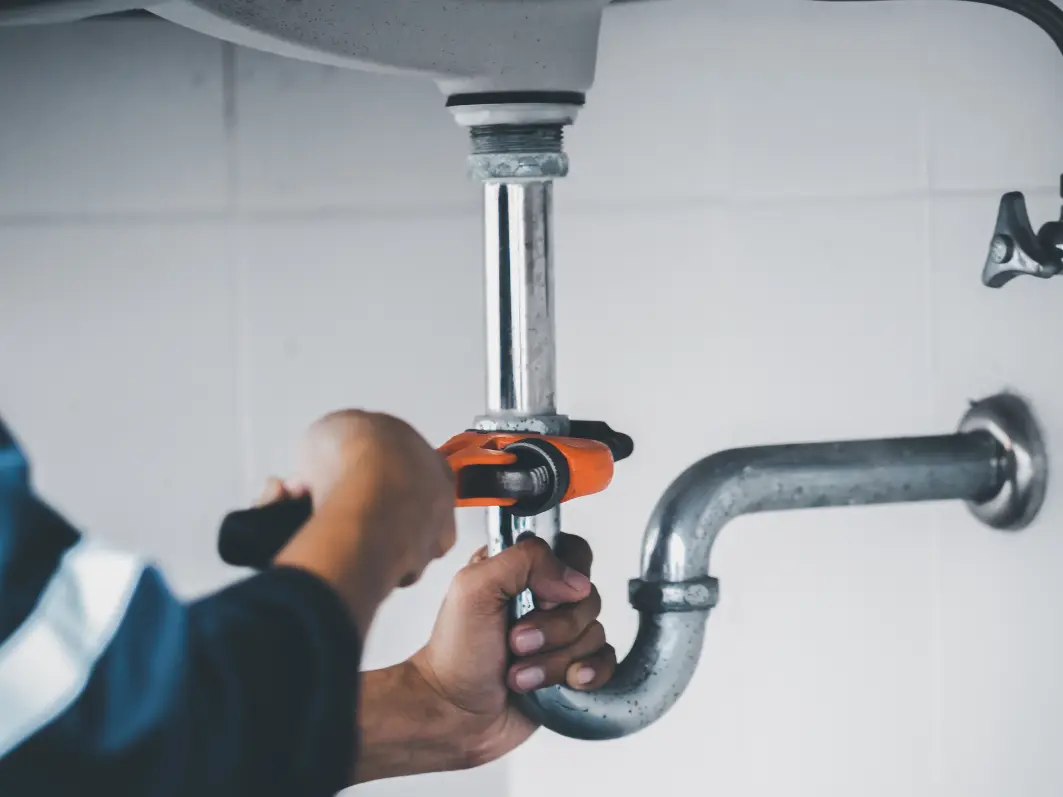
Average hourly rate $100 - $150
Average cost $75 - $500
Average price $200 - $500

A system-by-system guide to 2026 prices for jugs, under-sink, RO, UV, whole-house, softeners, and tank/bore filtration. Including who actually needs filtration and what to look for on the WaterMark sticker.
Based on historical review patterns on Word of Mouth, plumber demand in Cedar Vale tends to peak in April and is quietest in January. Booking during quieter months may mean more providers available and faster response times.
Start by comparing reviews from real customers — Cedar Vale has 53 plumber reviews on Word of Mouth.
Plumbers in Cedar Vale have an average rating of 4.7 out of 5 stars, based on 53 customer reviews on Word of Mouth. This is below the Queensland average of 4.89 stars.
Interesting pattern in Cedar Vale: income runs above the national median ($2,261/week vs $1,748/week) but local plumbers price 91% below the Queensland average. Worth comparing quotes to take advantage of that. For context, ABS Census 2021 data shows Cedar Vale has 100% of dwellings are standalone houses, a median age of 37, a median household income of $2,261/week.
